Most partner scorecards fail because they measure what's easy to count, not what drives performance. Effective scorecards require three distinct pillars: Foundation (is the partner operationally ready?), Investment (are they genuinely committed?), and Performance (is it translating to results?). Weight each pillar's metrics, establish RAG thresholds, and you'll have a scalable tool that gives C-suite visibility while enabling partner managers to pinpoint exactly where support is needed.
One of the first things I do with a client is take a hard look at their current partner scorecard. Is it a tool that drives partner behavior and surfaces actionable insights? Or is it a document they dust off once a quarter and quickly run through?
If you're like most partner organizations, it's the latter. And that's a problem—because a scorecard that doesn't drive behavior is just expensive noise.
The issue isn't that partner teams lack data. Most organizations are drowning in it. The issue is that they're often measuring what's easy to count rather than what actually drives performance. These easy-win metrics feel productive but rarely correlate to the outcomes leadership cares about: qualified leads, margin health, revenue, and sustainable growth.
A well-designed partner scorecard tells you three things:
- Whether a partner is operationally ready to perform
- Whether they're genuinely invested in their and your success
- Whether that investment is translating into measurable business results
Most scorecards try to do this with a single report pulled from a single system. That approach is nearly impossible and almost always fails.
The reality is that measuring meaningful ecosystem performance requires pulling together multiple data sources—partner portal analytics, your marketing automation platform, your deal registration system, your CRM, even notes from your partner sales teams…just to name a few—then organizing them into a framework that tells a coherent story.
I call this The Three Pillars.
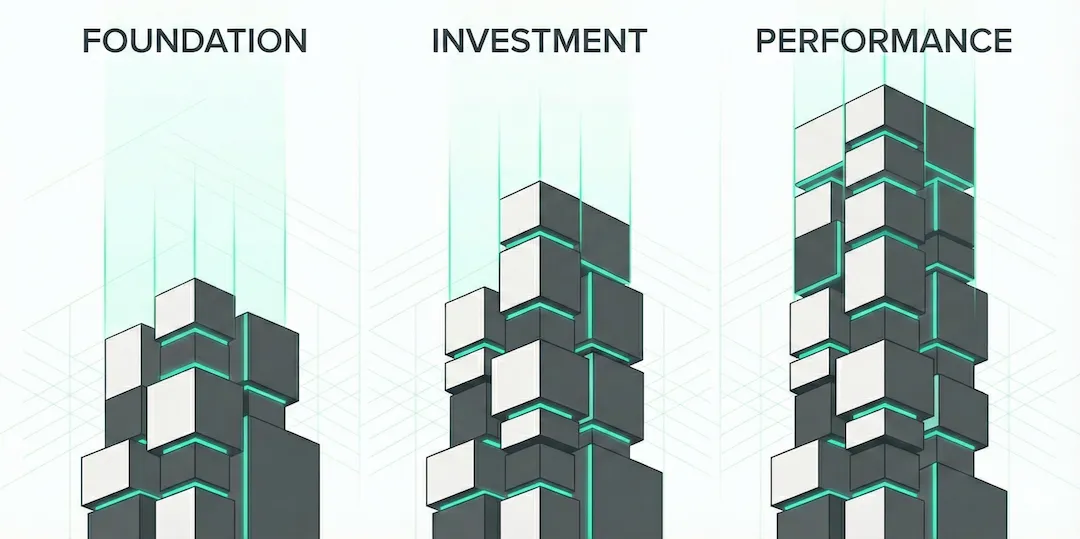
The Framework: Three Pillars of Partner Performance
Think of partner performance as three distinct but interconnected pillars. Each pillar represents a different phase of the partner lifecycle and requires different metrics to effectively measure said partner. The goal isn't to have partners perform well on one pillar—it's to have them rise to the top of all three.
- Pillar 1: Foundation measures whether a partner is operationally ready to sell with you. You're looking for things like: Are they onboarded? Do they understand your products? Have they built the internal relationships needed to execute? Have YOU built relationships with them?
- Pillar 2: Investment measures whether a partner is genuinely committed to your organization. Are they engaging with your resources? Are they co-selling with you and how are those motions going? Are they getting better at delivering qualified opportunities over time?
- Pillar 3: Performance measures whether that foundation and investment is translating into business results. This is where the rubber meets the road—deal quality, pipeline, margin health, and revenue—the indicators of sustainable growth.
There's no single list of metrics for each pillar—every company, GTM strategy, partner org, and ecosystem is different. But we can break down each pillar and explore metrics that commonly matter within them.
Pillar 1: Foundation
"Is this partner operationally ready to sell with us?"
Before you can expect revenue from a partner, you need to know they're equipped to generate it. This pillar focuses not just on finishing "onboarding," but on operational readiness—the baseline requirements for a partner to function effectively within your ecosystem.
The Foundation pillar answers a simple question: Have they completed the operational prerequisites that position them to succeed?
Organizations often skip this assessment and jump straight to measuring revenue, then wonder why certain partners underperform. The answer is usually hiding somewhere in this pillar.
Useful Key Metrics for Pillar 1: Foundation
- Contractual and Legal Completion: Has the partner signed all required agreements? NDA, partner agreement, any compliance documentation? This sounds basic, but you'd be surprised how many partners operate in limbo because paperwork stalled somewhere.
- Onboarding Milestone Completion: However your organization defines "onboarded," is this partner there? This might include technical integration status, sandbox environment access, or completion of required training modules.
- Portal Activation and Usage: Are they logging into your partner portal? More importantly, are they using the sections that matter? A simple Google Analytics integration can tell you whether partners are accessing deal registration, marketing resources, or enablement content—or whether your portal is a ghost town for them.
- Sales Team Introductions: Do their sellers know your sellers? Have the key relationships been established that will enable co-selling? A partner with great products but no internal connections to your sales organization will struggle to close deals.
- First Joint Account Mapping: Have you sat down together and identified mutual target accounts? Account mapping is often the first real indicator that a partner is serious about working with you.
- Partner Profile Completion: Is their listing in your partner directory or marketplace complete and accurate? This affects their visibility to your sales team and your customers.
- Initial Certification Status: Have the right people on their team completed the required training? Are they positioning themselves to be credible representatives of your solutions?
- First Deal Registration: Have they brought you their first opportunity? This is often the clearest signal that onboarding has translated into action.
Again, no single list of metrics applies perfectly to every organization. Foundation is a frame of mind—adopt it so you know your partners are set up for success.
Pillar 2: Investment
"Is this partner genuinely committed to our success?"
Once a partner is "fully baked" from a Foundation standpoint, the next question is whether they're actually investing in the relationship. This pillar measures ongoing engagement, capability building, and the depth of their commitment to your partnership.
Investment metrics are leading indicators. They tell you which partners are likely to perform well in the future based on the effort they're putting in today. A partner who's deeply engaged but hasn't yet produced significant revenue is often a better bet than one who got lucky with a single large deal but shows no signs of sustained commitment.
Useful Key Metrics for Pillar 2: Investment
- Marketing Engagement: Are they opening your partner marketing communications? Clicking through? Responding to calls to action? Low engagement here often signals a partner who's checked out or overwhelmed.
- Portal Usage Patterns: Beyond just logging in, are they using the high-value sections of your portal? Downloading sales collateral? Accessing competitive battlecards? Registering for enablement sessions?
- Meeting Cadence and Quality: Are they showing up to your regular check-ins? More importantly, are those meetings productive? A partner who attends every call but never has updates is coasting.
- Co-Selling Motion Development: Have they built joint selling plays with your team? Are those plays being executed? Co-selling requires genuine investment from both sides—partners who avoid it are often not serious about the relationship.
- Certification Depth: How many people on their team are certified? How current are those certifications? A partner with one certified person from three years ago is not the same as one with a dozen recently certified practitioners.
- Joint Solution Development: Have they built integrations with your products? Developed joint solutions? Created reference architectures? This represents serious investment that goes beyond transactional selling.
- Co-Marketing Investment: Are they utilizing MDF effectively? Contributing to co-branded content? Participating in joint events? Marketing investment signals long-term commitment.
- Executive Sponsorship: Are their leaders talking to your leaders? Executive engagement often predicts the trajectory of a partnership—when executives are involved, resources follow.
- Lead Volume and Velocity: How many opportunities are they registering per week or month? Is that number trending up, down, or flat?
- Lead Quality Trends: What percentage of their registered deals are being accepted by sales? Is that percentage improving over time? A partner who consistently brings unqualified opportunities is a drain on your sales organization.
- Deal Registration Cycle Time: How long are their deals sitting in registration purgatory before sales picks them up? Long cycle times can indicate quality issues, but they can also reveal problems on your side that need addressing.
Remember—no list of metrics is complete or final. Like Foundation, Investment is a frame of mind. Adopt it so you know your partners are right beside you on the front lines.
Pillar 3: Performance
"Is this partner delivering measurable business results?"
This is the pillar most organizations jump to first—and that's a mistake. Revenue metrics without Foundation and Investment context are misleading. But once you have that context, Performance metrics tell you whether everything is working.
Performance is where partner investment either pays off or doesn't. These are the metrics your CFO and board care about. But remember: poor performance usually traces back to gaps in Foundation or Investment. Fix those first, and Performance often follows.
Some Key Metrics for Performance
- Pipeline Generated: What's the total pipeline value from opportunities this partner has sourced? This is your leading indicator of future revenue.
- Pipeline Progression: How are partner-sourced opportunities moving through your sales stages? What's the conversion rate from Pipeline to Best Case to Commit to Closed Won? Slow or stalled progression signals deal quality issues.
- Win Rate: What percentage of partner-sourced opportunities close? How does that compare to direct sales or other partner cohorts?
- Deal Cycle Length: How long does it take to close partner-sourced deals compared to direct deals? Partners should accelerate deals, not slow them down.
- Average Deal Size: Are partner deals larger or smaller than your direct deals? Multi-product or single-product? Deal size and composition tell you a lot about partner sophistication.
- Closed Revenue: The number that matters most. What's the total closed-won revenue attributable to this partner?
- Customer Type Mix: Are partners bringing you net-new logos or expansion revenue from existing customers? Both are valuable, but understanding the mix helps you optimize partner focus.
- Product Mix: Are partners selling the same thing over and over, or are they trying to go wide?
- Discount Levels: What discounts are partners using to close deals? Are they margin-healthy or bleeding you dry? Discount analysis often reveals partners who are "buying" deals rather than earning them.
- Renewal and Retention: What are the renewal rates on partner-sourced customers? High initial close rates mean nothing if those customers churn. Some partners are great at landing deals but terrible at setting customers up for success.
- Upsell and Cross-Sell: Are partner-originated accounts expanding over time? Partners who build genuine customer relationships often drive better expansion revenue than direct sales alone.
Your Performance metrics will closely align with your company's or direct sales team's KPIs. These measurements are fairly standard across organizations and you likely already have them established. Generally speaking, Pillar 3 is the easiest to stand up on your Partner Scorecard.
Putting It Together: Weighting and Visualization
Once you've identified the metrics that matter for each pillar, the next step is weighting. Not every metric carries equal importance, and the right weighting depends on your business priorities, your partner types, and your growth stage.
For each metric, assign a weight based on its relative importance. Then, for each partner, score their performance against each metric and calculate a weighted score. This gives you a numerical representation of partner health that you can compare across your portfolio.
From there, establish your RAG thresholds—Red, Amber, Green—for each metric and each pillar overall:
- Red (Needs Development):
Partner is significantly below expectations. Requires intervention or may not be a fit. - Amber (Meeting Expectations):
Partner is performing adequately but has room for improvement. Monitor and support. - Green (Exceeding):
Partner is performing well across this metric. Celebrate and replicate.
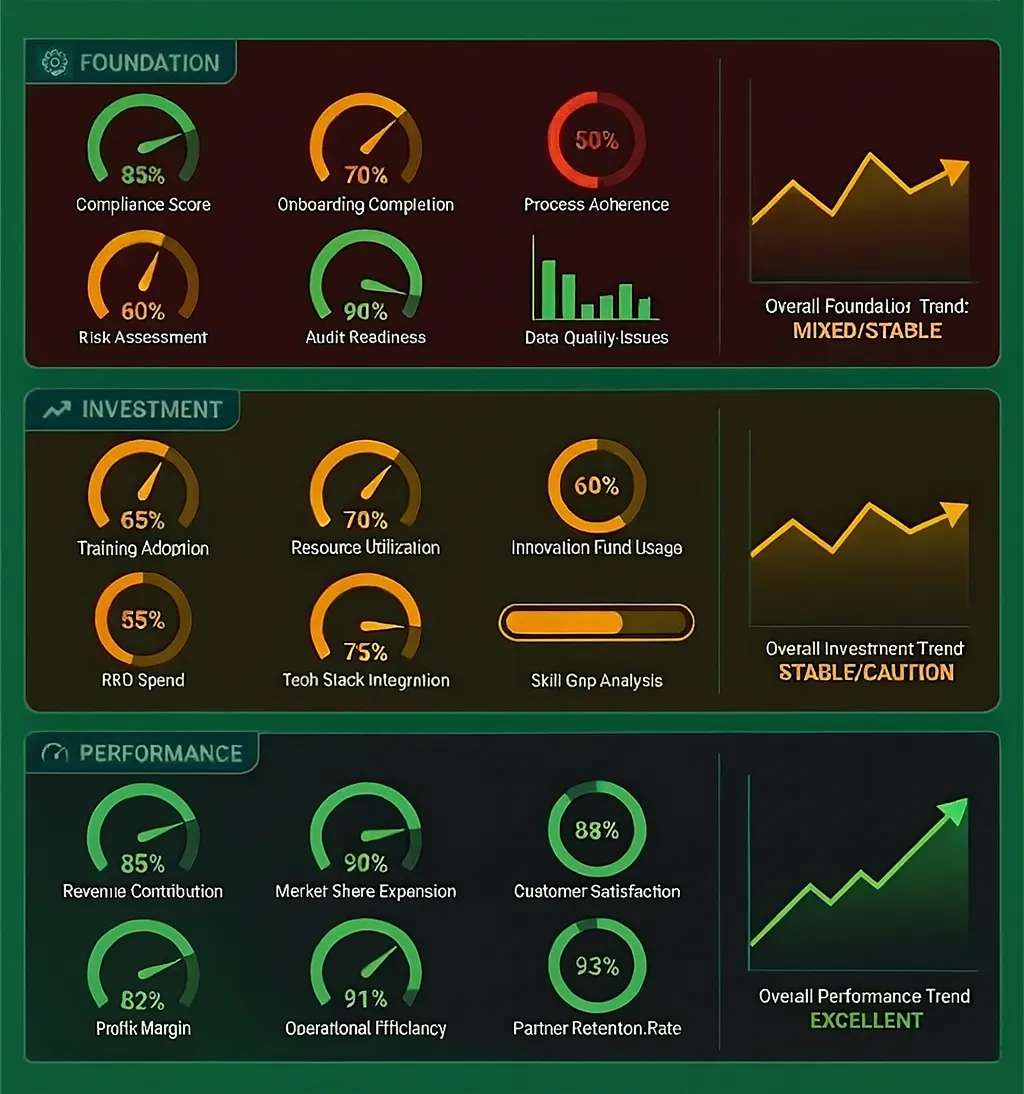
(conceptual illustration of a Three Pillars dashboard)
The power of this framework is scalability. With proper weighting and RAG thresholds, you can roll up individual partner scores to see how entire partner cohorts are performing—by partner type, by geography, by vertical, by tenure.
This scalability is the magic behind this framework. A C-suite executive can see at a glance how healthy (or unhealthy) each part of their partner ecosystem is, while a partner manager can drill down to identify exactly where a specific partner needs support.
Practical Considerations
A few things to keep in mind as you build your scorecard:
- Data sources matter. Your scorecard is only as good as the data feeding it. Before you finalize your metrics, make sure you can actually capture them reliably. A beautiful scorecard built on unreliable data will erode trust faster than no scorecard at all.
- Start with what you have. You don't need perfect data coverage on day one. Start with the metrics you can measure today, prove the framework's value, then expand. A scorecard that covers 60% of the ideal metrics but actually gets used beats a comprehensive scorecard that lives in a spreadsheet no one opens.
- Context varies by partner type. A cloud marketplace partner will have different Foundation and Investment indicators than a traditional reseller. Your scorecard framework should be consistent, but the specific metrics and weights may vary by partner segment.
- Review and iterate. Your first version won't be perfect. Plan to review and refine your scorecard quarterly based on what you learn. Are certain metrics proving more predictive than others? Are thresholds set appropriately? Continuous improvement is part of the process.
- Make it actionable. Every metric on your scorecard should connect to a possible action. If a metric goes Red, what do you do about it? If you can't answer that question, reconsider whether the metric belongs on your scorecard.
The Bottom Line
Partner scorecards fail when they try to boil everything down to a single number or a single system. The reality of partner ecosystems is messier than that. Foundation, Investment, and Performance are distinct concepts that require not just different data sources, but different thinking.
Build your scorecard on three pillars. Weight the metrics that matter for your business. Establish clear thresholds that drive action. And remember: the goal isn't to create a report—it's to create a tool that changes behavior, surfaces insights, and ultimately drives measurable business outcomes.
That's what separates scorecards that measure activity from scorecards that drive performance.
A Note on Using AI with The Three Pillars
One of the best use cases for AI in partner operations is exactly this kind of framework development. Whether your organization has strict data policies or gives you free rein, AI can accelerate your scorecard design.
If your company restricts AI access to internal data, you can still get significant value. Describe your business in generic terms to any AI assistant: "We're a SaaS company selling cybersecurity products with 8-month sales cycles. We work with cloud marketplace partners, resellers, and SI partners. Based on the Three Pillars framework, what metrics should I consider for each pillar?" You'll get tailored suggestions you can then validate against your actual data sources—without ever exposing sensitive information.
If your organization allows AI access to internal data, the possibilities expand dramatically. Tools like Google's NotebookLM or a Claude Project can ingest your existing reports, CRM exports, and portal analytics. From there, you can have AI help you identify which metrics you're already capturing, surface gaps in your current measurement approach, and even draft initial weighting recommendations based on your business priorities. The AI becomes a thought partner that helps you connect dots across data sources that previously lived in silos.
Either way, the Three Pillars framework gives AI the structure it needs to be useful. Without a clear framework, AI tends to generate generic, unhelpful suggestions. With the pillars as guardrails, you're asking focused questions that generate actionable answers.